Design of a Linear Motion Slide, Part 3
The goal this week was to finish fabricating the linear motion slide and complete the stiffness, accuracy and repeatability testing — while keeping notes on the manufacturing techniques so I could build the second slide over spring break.
1. Design updates
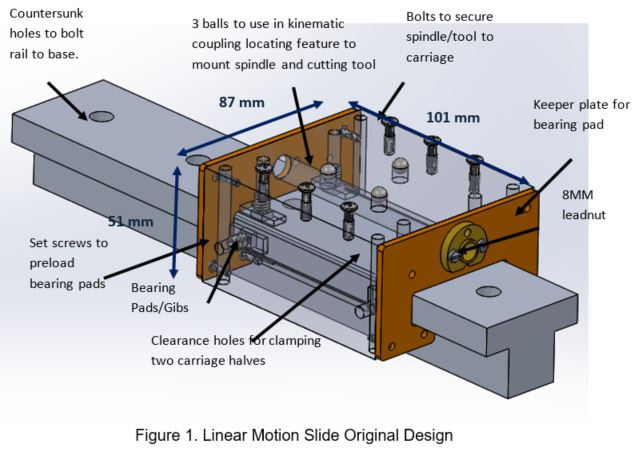
Two changes from the original. The rail is no longer an I-beam but a pure T-beam. And the carriage is no longer one piece of aluminium but two pieces of 25.4 × 87 × 101 mm stock, bolted and JB Welded together.
2. Manufacturing
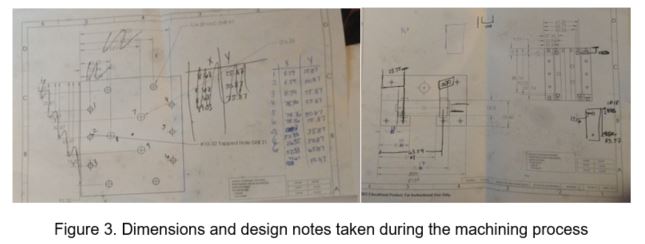
The first slide took much longer than expected. I hadn’t used a mill in a while, so it was slow going until I learned the CNC features, which sped things up considerably. I took a lot of drawing and design notes while machining so the features and drawings would be clearer and easier to program next time.
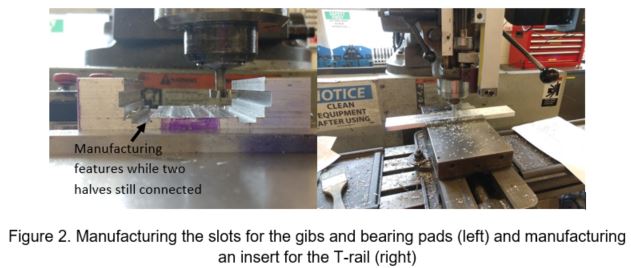
Two aspects are worth elaborating on.
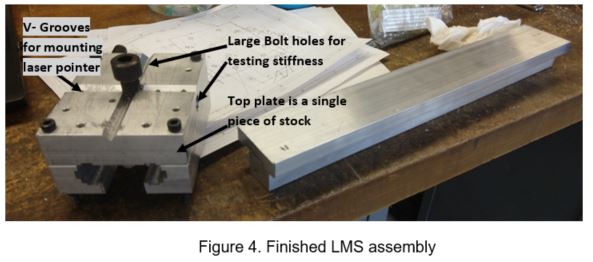
Designing in the test features. I knew going in that the carriage needed features that would let me test its stiffness and accuracy. Every stiffness value can be reached with a ½-13 tapped bolt hole on the top and on the side of the carriage: with an eye-hook bolt, pulling on the two configurations in different directions applies a specific, known moment or force about a chosen axis. I also cut perpendicular vee-grooves to mount a laser pointer along the carriage’s x and z axes, for rotational stiffness plus yaw and pitch accuracy and repeatability.
Machining the side and keeper plates from one piece of stock. Doing it this way meant all the features — the bearing pad slots and the T-rail slots — got machined at once, and the two halves could then be separated accurately and with confidence that the parts are symmetric.
3. Testing
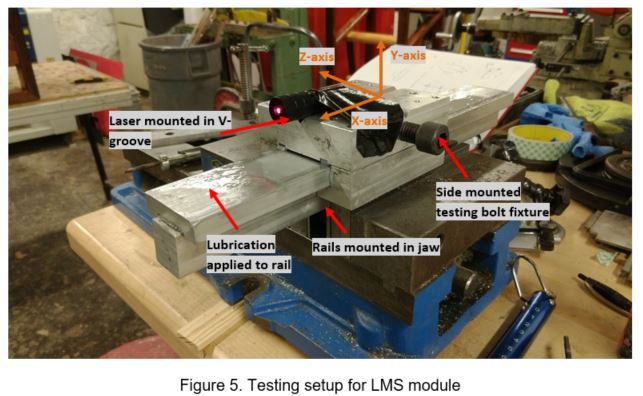
Rotational and linear stiffness were tested with 100 N spring scales. Rotational stiffness came from applying a moment about x, y and z separately and measuring deflection with the laser projected 8 metres away.
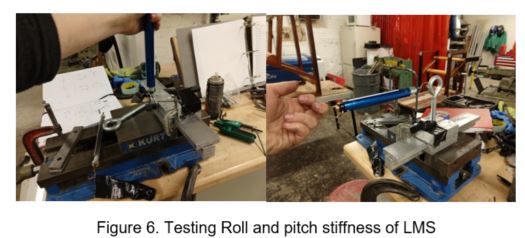
Linear stiffness along y and z used a dial indicator fixed to the vise base. Neither axis showed measurable deflection — the system is stiffer than my instruments can resolve.
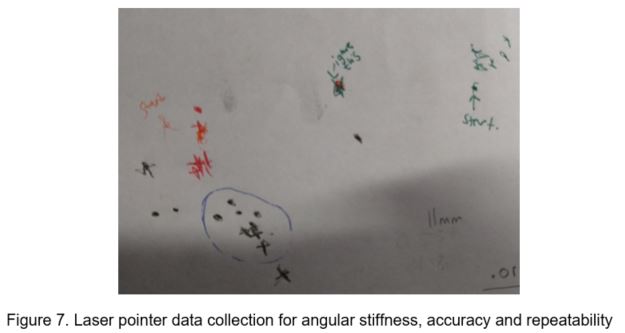
Pitch (θz) and yaw (θy) accuracy and repeatability came from marking where the laser landed with the carriage at each extreme of its travel.
The model was wrong, and fixing it
Roll stiffness agreed reasonably with the spreadsheet. Yaw came in about 1/10th of prediction and pitch about 1/20th.
My original model treated the entire carriage as a simply supported beam under various moment loads. I swept the sensitive parameters and found that no reasonable set of carriage values would produce the stiffness I was actually measuring — which is the useful kind of negative result, because it says the model form is wrong rather than its inputs.
Re-analysing the carriage: the top is 25.4 mm thick aluminium, so any deflection I measured was almost certainly the side and bottom plates bending, not the whole carriage acting as a beam. I rewrote the analysis so pitch stiffness is a torsional load on the bottom plates and yaw stiffness a torsional load on the side plates. With only small parameter tweaks — thickness, length — the prediction matched the measurement.
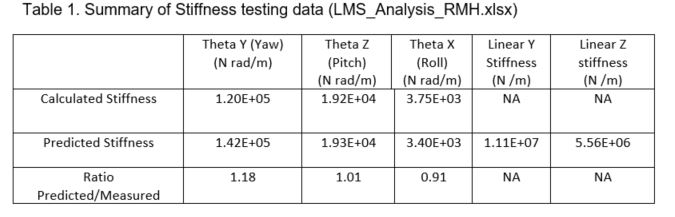
Ratios of 1.18, 1.01 and 0.91 — the corrected model tracks the hardware.
Accuracy along the rail
Yaw and pitch accuracy came from the distance between the average positions of the data clusters as the carriage travelled rear to front. Vertical separation between cluster means indicates pitch error from the flatness of the slide; horizontal separation indicates yaw error. Repeatability is the standard deviation within each cluster.
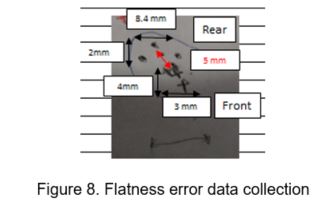
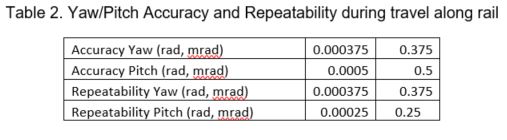
There is a lot of error as the carriage travels the length of the rail. A large part of it is that I haven’t worked out how to manufacture the bearing pads accurately and repeatably — they were cut on the band saw, and I think the testing reflects exactly that. Finding a more consistent process is a spring break job.
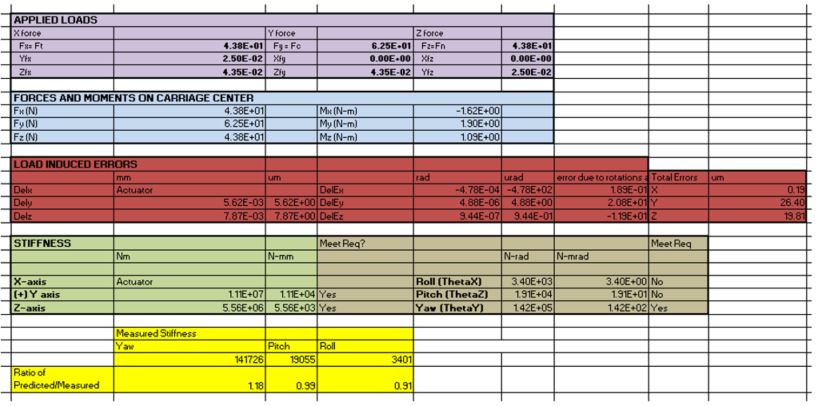
With that correction in place, I believe the spreadsheet can now predict the accuracy of a part manufactured on this slide.
Then chaos struck
While I was writing this report and handling the carriage, one of the sides fell off.
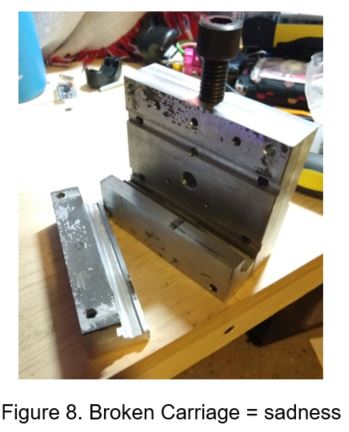
There’s a chance I didn’t prepare the surface well enough before epoxying. I did clean it, apply the epoxy, clamp the pieces and leave them 15 hours — but perhaps they needed longer.
Luckily all the testing was already done. Part of me wonders whether the measured-versus- predicted discrepancy was partly the epoxy joint all along. I’ll retest the module once I’ve properly re-bonded the carriage and made some decent bearing pads.
Testing the linear motion slide
- LMS_Analysis_RMH.xlsx — including the LMSTesting sheet with all measurement data — 142.1 MB, too large to host here