Design of a Kinematic Coupling, Part 2
Kinematic couplings constrain all six degrees of freedom of a body through exactly six points of contact, which is what makes the removable half return to the same place every time. The Maxwell layout — three spheres on one platform, three vee-blocks on the other — is the common way to arrange those six points.
The real advantage of a deterministic design is that you can predict what it will do. This week’s hardware assignment was to design a coupling and then compare predicted stiffness, accuracy and repeatability against the measured article.
Design process
I started with an FRDPARRC table.
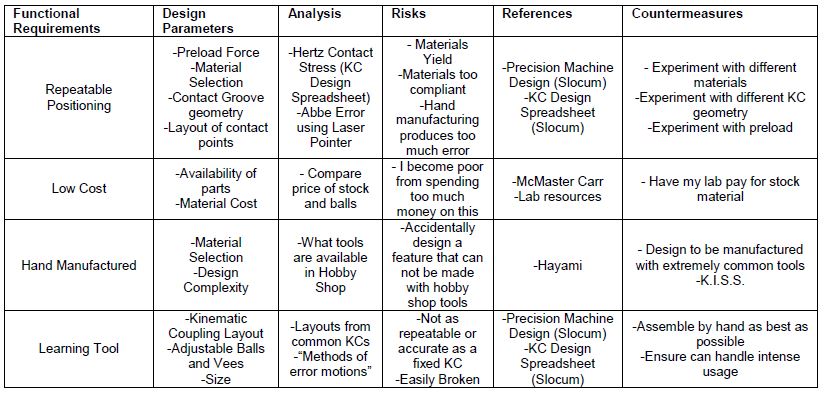
Having already built a kinematic coupling in Medical Device Design (2.75), I pointed this one at a different question: make it a learning tool that shows how manufacturing tolerance affects positional accuracy. What actually happens if the ball positions or the vee machining are loosely toleranced? How does stability change with an isosceles coupling triangle instead of the usual equilateral one? I wanted to be able to demonstrate those answers, not just assert them.
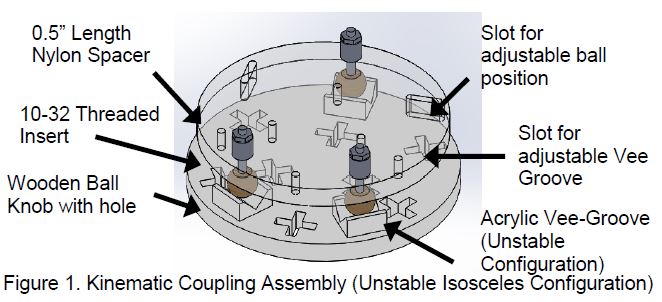
So the SolidWorks model carries several configurations at once: a standard stable equilateral triangle, a stable isosceles triangle, and an “error simulation” equilateral triangle. The vee grooves mount two ways as well — pointed at the coupling centroid for a stable system, or radially along the coupling circle for a deliberately unstable one.
Manufacturing and assembly
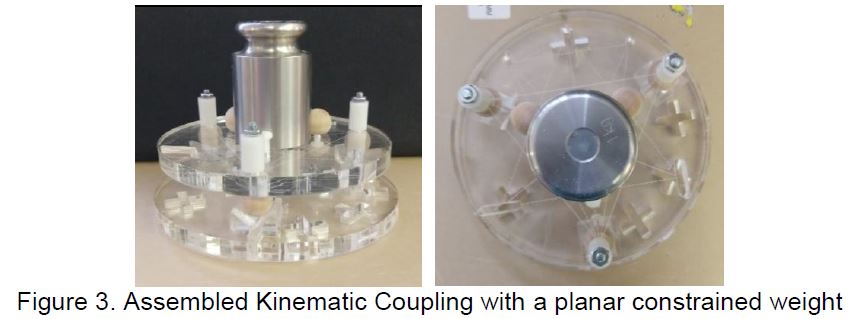
Time to manufacture and material availability drove most of the build. As a teaching tool it had to be big enough to handle and adjust — at least 6” across — and it had to make the effects of manufacturing error visible. That last requirement ruled out wood: being able to see the balls sitting in the vee grooves is most of the demonstration. Clear 0.5” acrylic on a laser cutter it was.
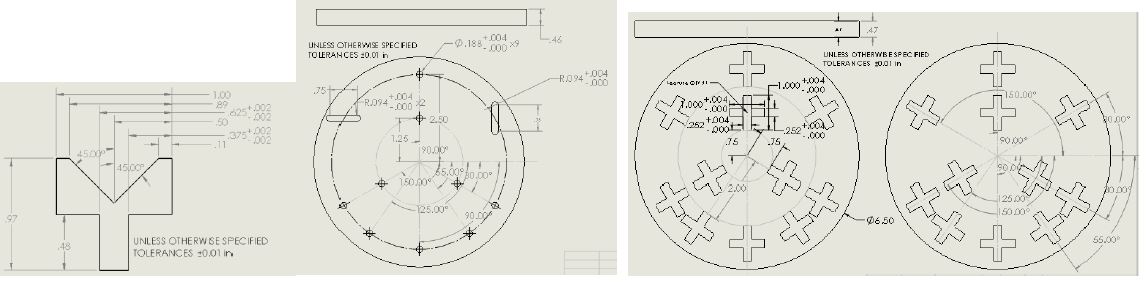
Laser cutters are notorious for tapering thick material, so I ran trials across power, speed and pass count. Three passes at 100% power and 10% speed, refocusing between passes, came out most accurate. I also rastered the coupling triangles connecting the possible ball positions onto the top plate, so the geometry being demonstrated is visible on the part.
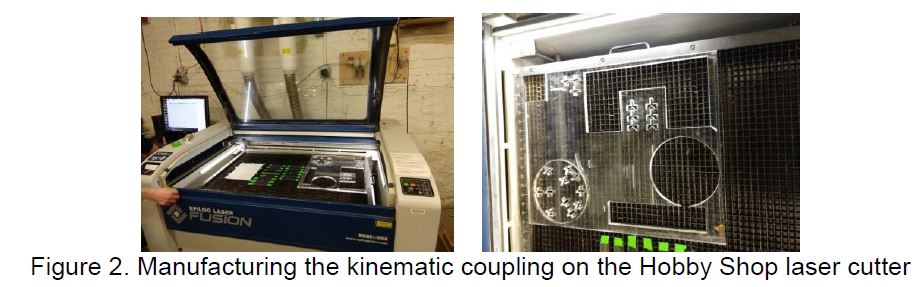
Even with that care, the cutter seemed to be having an off day — a lot of parts came out noticeably slanted, closer to a parallelogram than a rectangle. I hadn’t seen error that extreme from a laser before, though I usually cut material under ¼” thick. After handling the pieces I judged that the coupling could still do its job, so I carried on to assembly.
The multiple ball locations turned out to have a second use: extra balls mounted on top of the coupling let a 1 kg weight be positioned repeatably as an applied load. That matters, because it separates the repeatability of the coupling from the error introduced by a load that shifts between trials. The same feature positions the laser pointer repeatably, which is what makes the stiffness measurement possible.
The 10-32 threaded inserts were JB Welded into the balls and left overnight. The vee grooves were made by superglueing pairs of 0.5” grooves together and sanding the edges, giving three 1”-thick grooves.
Testing
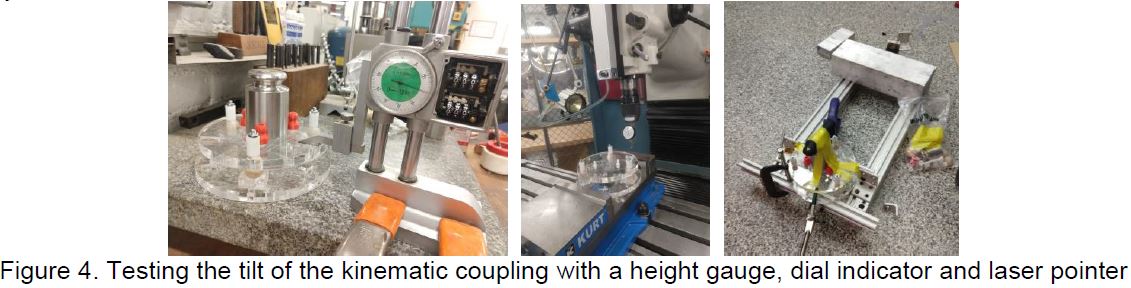
Accuracy. A height gauge on a granite slab, zeroed on the slab, with the coupling spring-clamped to the same slab. Measure the coupling height, lift the top plate off, replace it, repeat ten times.
| SolidWorks model height | 46.49 mm |
| Measured average | 46.27 mm |
| Difference | under 0.5% |
Stiffness. The coupling went on the lathe with a dial indicator in the chuck. Apply a known 0.5 kg load, zero the indicator, lift and replace the top plate, record. Ten times, then ten more at 1 kg. Averaging each load case and applying F = kx:
| Measured stiffness | 0.134 N/µm |
| Versus prediction | about 20× less stiff |
Repeatability. Same rig — the standard deviation across measurements gives it directly.
| Axis / load | 95% of measurements (2σ) fall within |
|---|---|
| z-axis, 0.5 kg | 5.89 µm |
| z-axis, 1 kg | 2.62 µm |
| y-axis, 1 kg | 5.46 µm |
| angular, 1 kg | 1.26 mrad (0.07°) |
The y-axis figure came from running the indicator against the side of the top plate. The angular figure used the laser pointer taped to the loaded coupling, measured 156” away and converted through Abbe error, raising and lowering the top plate ten times.
Conclusions
The measuring tools only read reliably to 12.7 µm — anything finer was estimated by eye, so better instruments would likely have tightened these numbers.
The 20× stiffness shortfall genuinely puzzles me. I attribute much of it to the measurement setup and to slight bumping during testing, but the ball and vee dimensions, or the material properties of the wood and acrylic, could also be off. I experimented with the spreadsheet to see whether either could account for the gap and the test was inconclusive. I also checked whether the top plate was simply bending under load — the analysis puts that at only 1–2 µm under 10 N, so it isn’t the explanation.